BALTIMORE (Stockpickr) -- 2014 has been a good time to be a U.S. investor. Since the calendar flipped to January, the big S&P 500 has climbed more than 8.29%. That's why it may come as a surprise that you could be leaving money on the table if you're investing exclusively in domestic stocks.
Read More: 5 Rocket Stocks Ready for Blastoff This Week
The S&P 500 isn't close to being the best-performing equity market this year. In fact, it's not even the best-performing market in the Americas (that trophy goes to Argentina's Merval Index, up 53% so far).
The biggest benefit of owning foreign stocks is that they often carry much lower correlations with the big U.S. indices. In other words, when domestic names are performing poorly, there's often a foreign market that's rallying. And better yet, they're easy to buy: There are thousands of ex-U.S. stocks that trade here on major U.S. exchanges.
So today, we're taking a closer technical look at five big foreign stocks to trade for gains.
For the unfamiliar, technical analysis is a way for investors to quantify qualitative factors, such as investor psychology, based on a stock's price action and trends. Once the domain of cloistered trading teams on Wall Street, technicals can help top traders make consistently profitable trades and can aid fundamental investors in better planning their stock execution.
Without further ado, let's take a look at five technical setups worth trading now.
Read More: 10 Stocks Billionaire John Paulson Loves in 2014
21Vianet Group
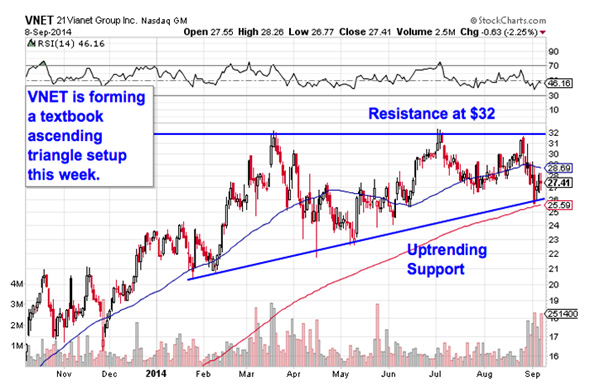
Up first is 21Vianet Group (VNET), a $2 billion Chinese internet data center stock. VNET has been a good bet so far in 2014: Since the start of the year, shares have climbed about twice as much as the S&P. And now, with a bullish technical setup in place, they look ready to make a second leg higher.
VNET is currently forming an ascending triangle pattern, a bullish price setup that's formed by horizontal resistance to the top of the pattern (at $32 in the case of VNET), and uptrending support to the downside. Basically, as this stock bounces in between those two technically significant price levels, it's getting squeezed closer and closer to a breakout above that $32 price ceiling. When that happens, we have a buy signal in shares.
This has been a longer-term setup, and now the 200-day moving average has started acting like a proxy for support. That makes that red line a logical place to keep a protective stop below.
Read More: 3 Big-Volume Stocks to Trade for Breakouts
Flextronics International
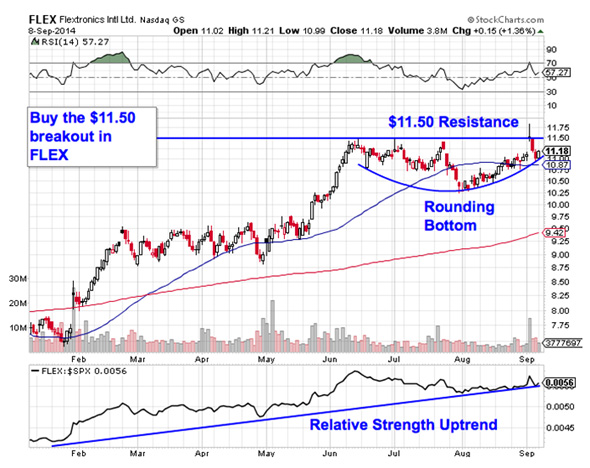
Singapore-based Flextronics International (FLEX) is another overseas-based stock that's close to a breakout in September after a bullish start to the year. Since January, FLEX is up almost 44%. Here's how to trade it now.
Flextronics is forming a rounding bottom, a bullish setup that indicates a gradual shift in control of shares from sellers to buyers. The rounding bottom pattern looks exactly like it sounds, and even though FLEX's pattern is actually at the top of its recent range, the trading implications are exactly the same. A breakout above $11.50 is the signal that the pattern is completed and it's time to be a buyer.
Relative strength adds some confidence to the upside trade in FLEX: the relative strength line has been making higher lows all year long. As long as that uptrend in relative strength stays intact, FLEX should keep outperforming U.S. stocks as a group.
Read More: 10 Stocks George Soros Is Buying
Delphi Automotive
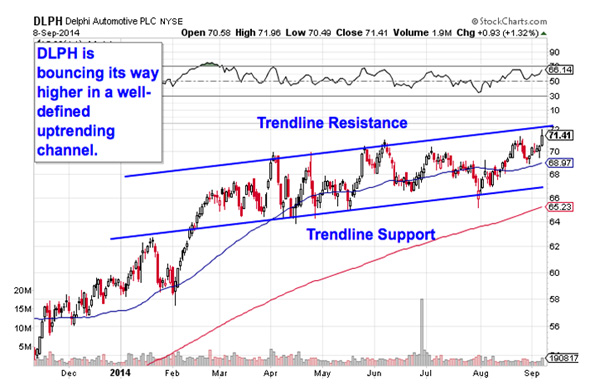
Even though Delphi Automotive (DLPH) started out as a unit of U.S. based General Motors (GM), this UK-based auto parts maker's exposure to foreign markets makes it an overseas play more than the fact that its corporate headquarters happens to be in England. Delphi has been harnessing some big tailwinds in the global automotive business for the last few years, and it doesn't take an expert technical analyst to figure out how that's playing into this stock's chart.
Put simply, Delphi has been a "buy-the-dips stock" for most of 2014.
Delphi has been bouncing its way higher in an uptrending channel since the middle of February. The channel, formed by a pair of parallel trend lines, identifies the high probability range for shares to stay within. So far, every successive test of trend line support has provided a low-risk, high-reward chance to buy shares. Now, with DLPH sitting towards the top of its channel, traders looking for an optimal opportunity to get into Delphi just need to exercise a little patience.
Read More: 3 Huge Stocks to Trade (or Not)
JD.com
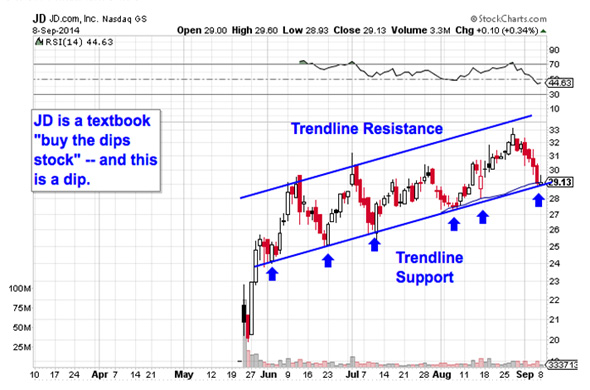
We're seeing the exact same setup this week in shares of Chinese direct sales company JD.com (JD). Just like DLPH, this recent IPO has been bouncing its way higher in a well-defined uptrend. The big difference here is that shares are showing traders a key test of support this week. That means it makes sense to buy the bounce.
Waiting for a bounce is important for two key reasons: It's the spot where shares have the furthest to move up before they hit resistance, and it's the spot where the risk is the least (because shares have the least room to move lower before you know you're wrong). Remember, all trend lines do eventually break, but by actually waiting for the bounce to happen first, you're ensuring JD can actually still catch a bid along that line before you put your money on shares.
The 50-day moving average has been a perfect proxy for support over the course of this pattern; I'd recommend keeping a protective stop on the other side of it if you decide to buy shares this morning.
Read More: 5 Stocks Poised for Big Breakouts
Qiwi
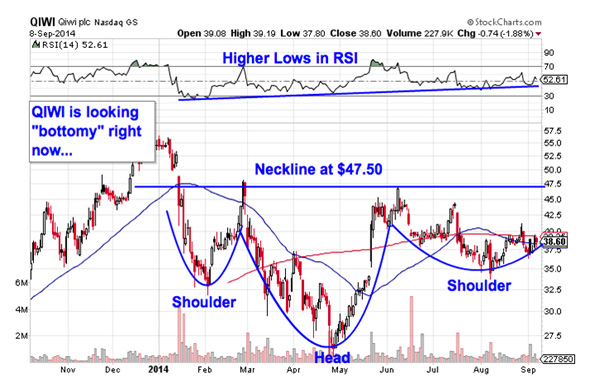
Last up is Russian payment services firm Qiwi (QIWI), a name that hasn't had a very good run at all in 2014. In fact, shares of QIWI are down more than 31% over the last eight months, making this $2 billion name one of the worst-performing ways to get exposure to the growth of global electronic payments.
The good news for shareholders is that could be about to change -- QIWI is starting to look "bottomy" here.
QIWI is currently in forming an inverse head and shoulders pattern, a bullish setup that indicates exhaustion among sellers. You can spot the inverse head and shoulders by looking for two swing lows that bottom out around the same level (the shoulders), separated by a bigger trough called the head; the buy signal comes on the breakout above the pattern's "neckline" level, currently right at $47.50 resistance.
Momentum adds some extra confidence in QIWI's upside potential right now: 14-day RSI has been making higher lows, even during the deep trough made by this pattern's head. That's a bullish divergence in RSI that points to a bounce in shares. Remember, QIWI is a long-term pattern, and that comes with long-term trading implications.
Read More: Must-See Charts: How to Trade 5 Apple, Google, Wells Fargo
To see this week's trades in action, check out the Technical Setups for the Week portfolio on Stockpickr.
-- Written by Jonas Elmerraji in Baltimore.
RELATED LINKS:
>>5 Stocks Set to Soar on Bullish Earnings
>>Hedge Funs Love These Consumer Stocks -- Should You?
>>4 Tech Stocks Rising on Unusual Volume
Follow Stockpickr on Twitter and become a fan on Facebook.
At the time of publication, author had no positions in stocks mentioned.
Jonas Elmerraji, CMT, is a senior market analyst at Agora Financial in Baltimore and a contributor to
TheStreet. Before that, he managed a portfolio of stocks for an investment advisory returned 15% in 2008. He has been featured in Forbes , Investor's Business Daily, and on CNBC.com. Jonas holds a degree in financial economics from UMBC and the Chartered Market Technician designation.Follow Jonas on Twitter @JonasElmerraji
No comments:
Post a Comment